Trading Platform Development.
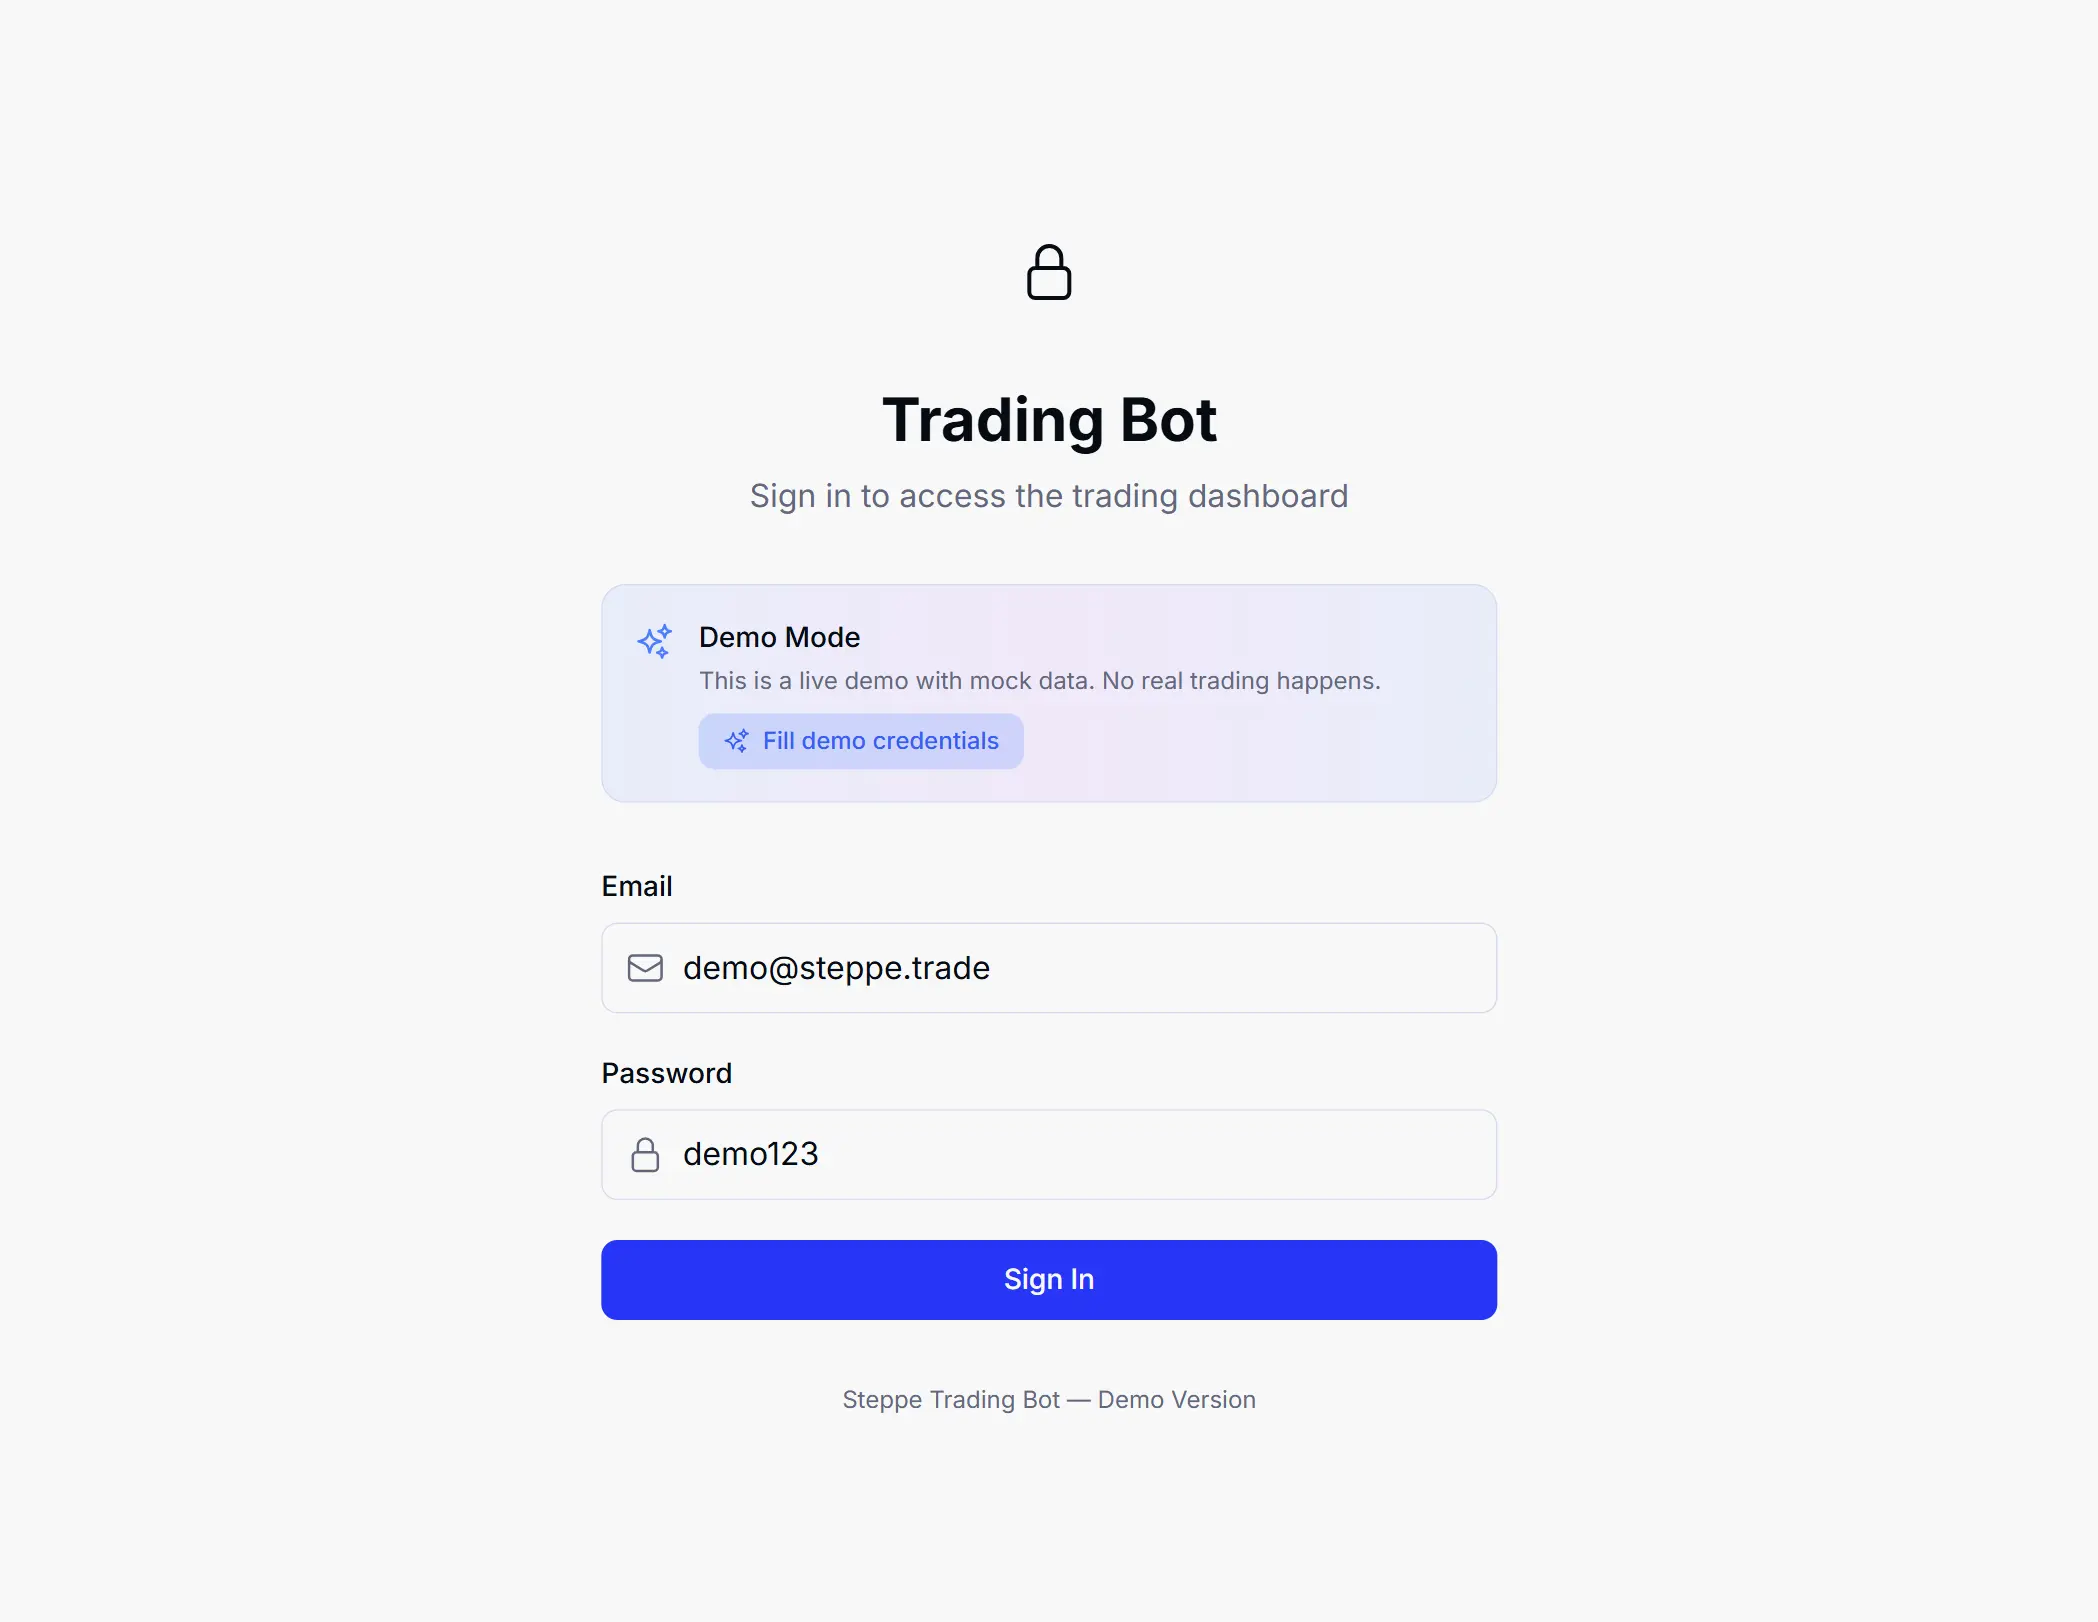
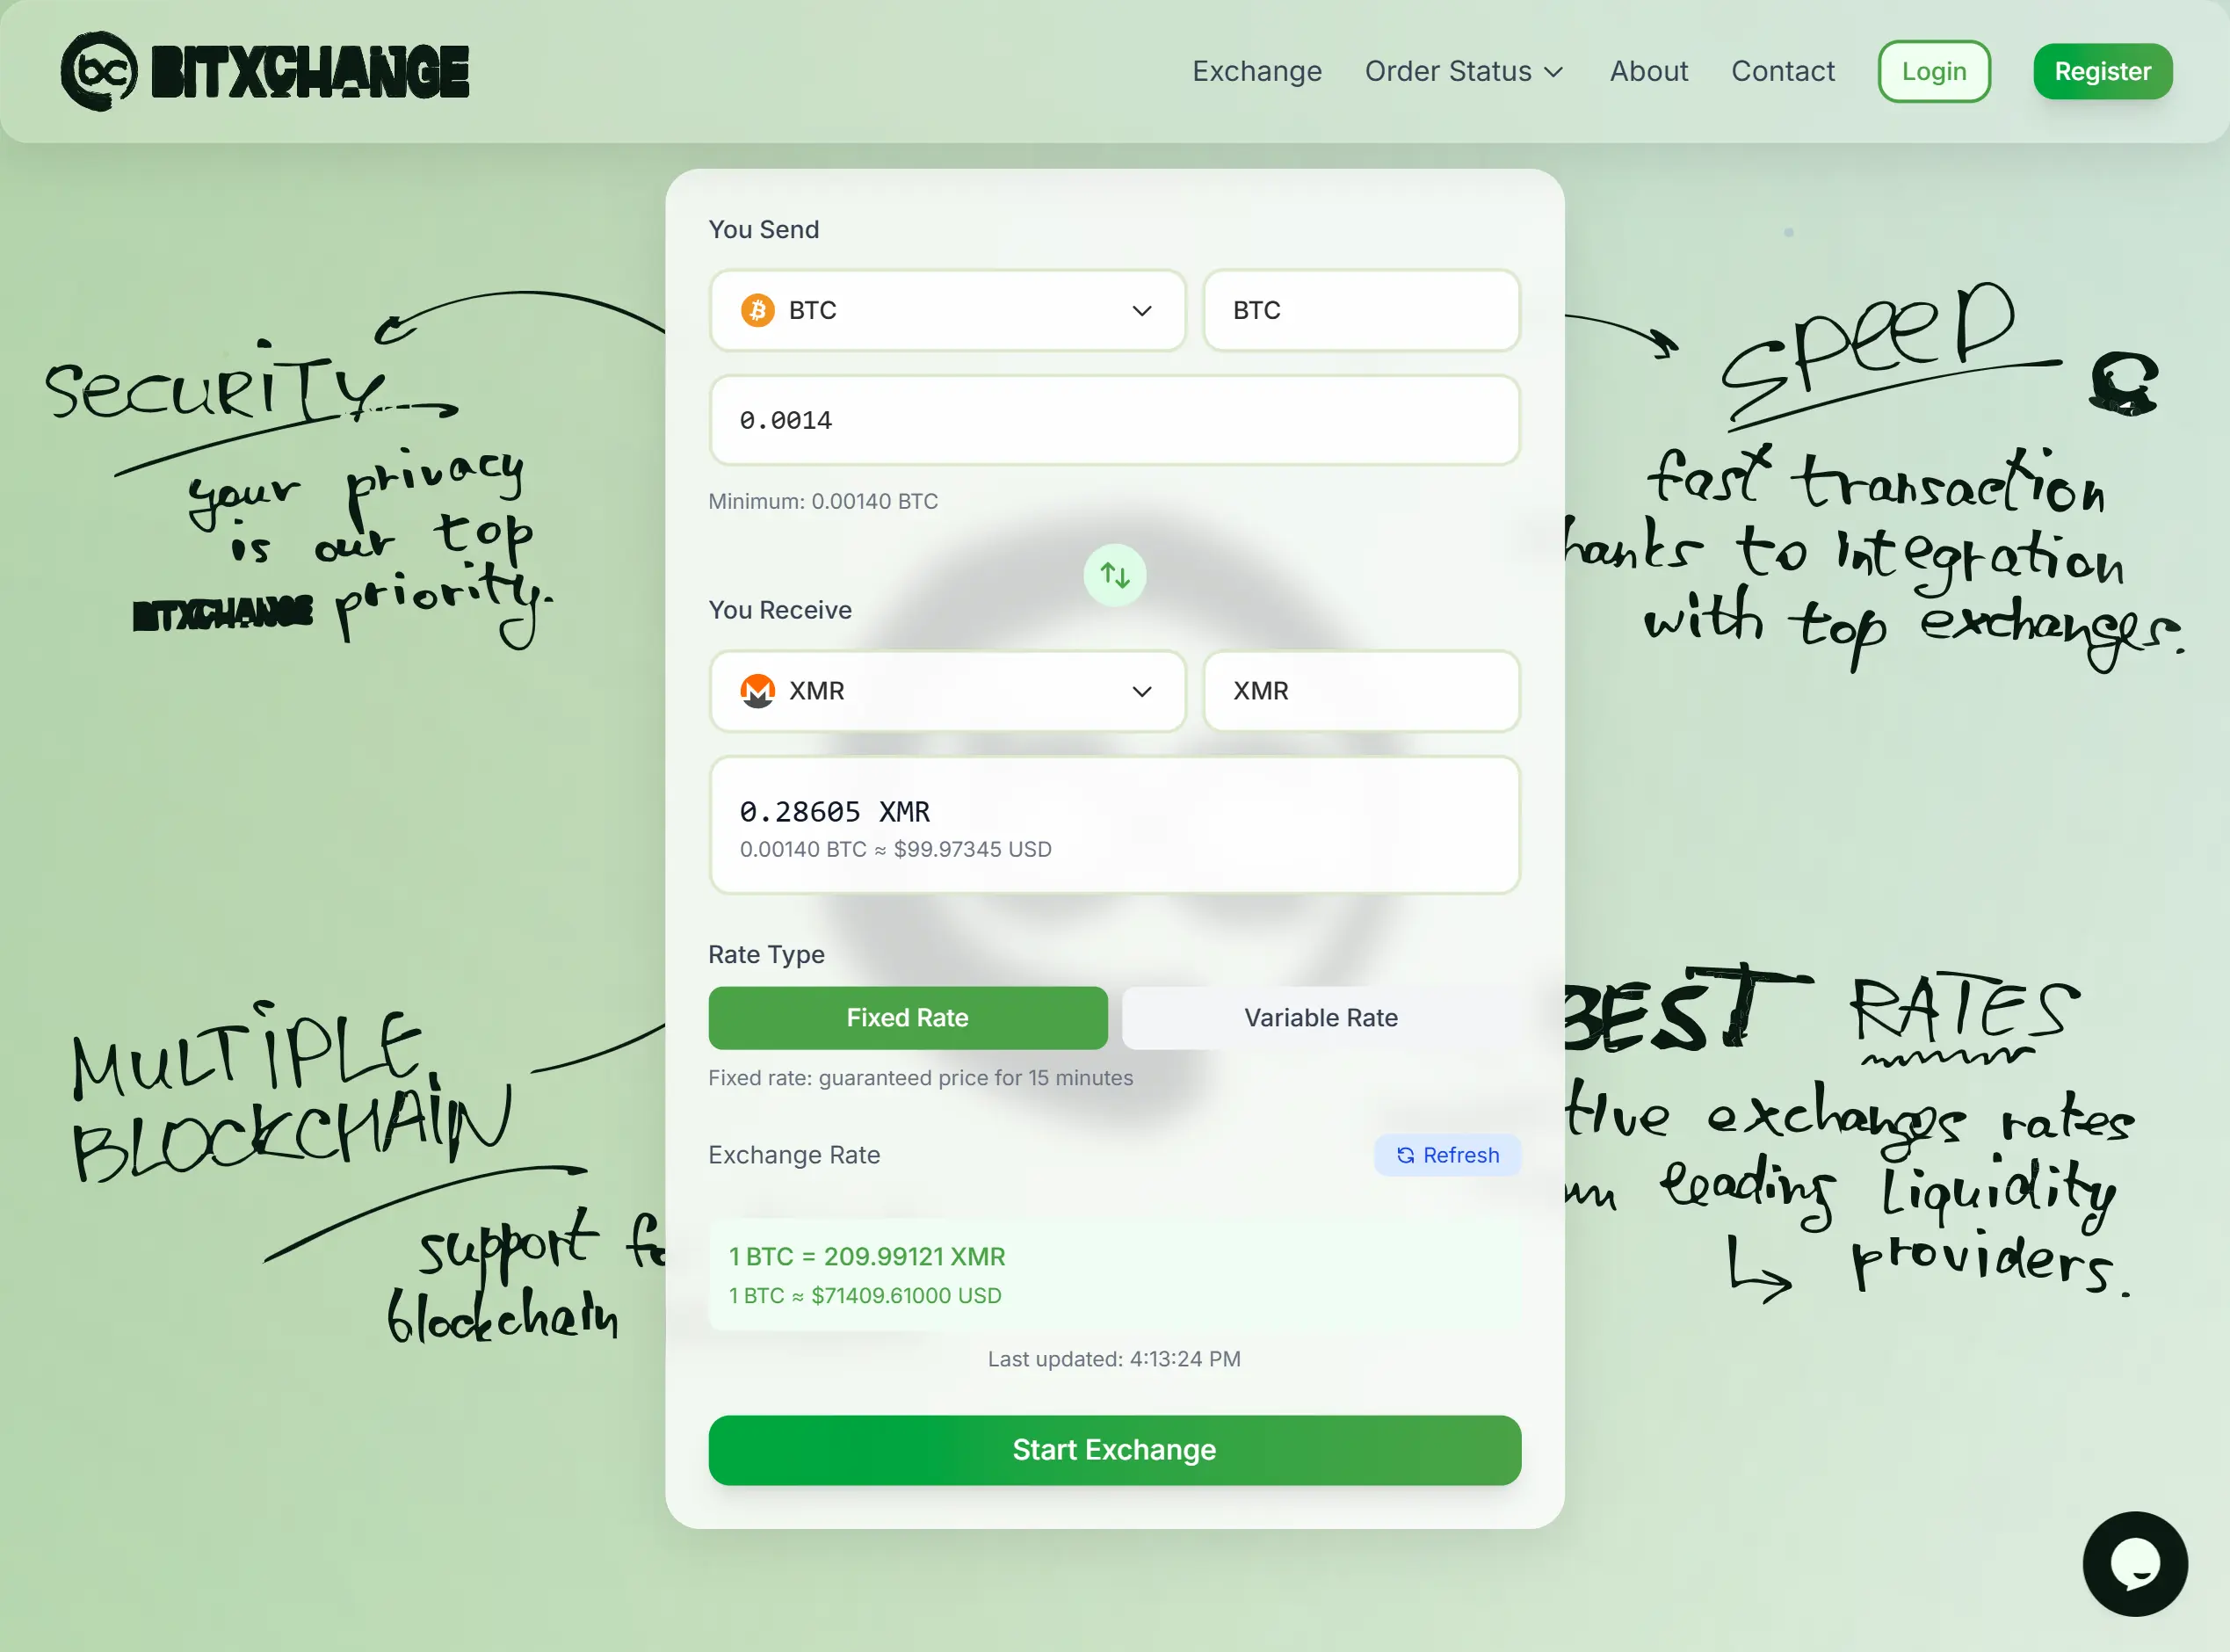
We build trading platforms where stale data is a bug: real-time dashboards for automated strategies, order management and execution screens, portfolio and risk views, and the back-end services that normalise market data from several venues. TradeBot, a dashboard for automated trading workflows, and the BitXChange trading interface are two examples.
Discuss your productWho this is for.
- 01
Algorithmic and quantitative teams that need a monitoring and control surface for strategies running in production
- 02
Brokers and prop firms replacing a vendor terminal with a branded, customisable platform
- 03
Fintech startups launching an investment or trading app and needing the data pipeline behind the UI
What's included
- 01
Market data ingestion from exchanges and brokers with normalisation and reconnect logic
- 02
WebSocket distribution with snapshots, deltas and client-side state that stays consistent
- 03
Dashboards: positions, P&L, open orders, fills, strategy status and alerts
- 04
Order entry and management with validation, confirmations and audit trail
- 05
Charting with indicators, overlays and strategy markers
- 06
Risk controls: limits, kill switches, exposure and drawdown monitoring
- 07
Operator tooling: parameter changes, pause/resume, incident view
- 08
Backtest and paper-trading modes where strategies are involved
How we build it.
The difference between a trading UI that feels instant and one that stutters is almost entirely in how data flows. We separate server state (orders, positions, fills) from streaming state (prices, books), normalise every venue into one internal model, and render selectively so a tick on one instrument never re-renders the whole screen. Back ends in Python or Node.js handle ingestion and execution; the front end is Next.js and TypeScript.
- 01
One normalised market-data model regardless of venue, with per-venue adapters
- 02
Snapshot plus delta protocol over WebSockets with sequence numbers and gap detection
- 03
Selective rendering and virtualised tables so dense screens stay at 60 fps
- 04
Every operator action logged with before/after state for audit and incident review
Scope, timeline and budget.
Ranges are based on recent projects. After a discovery call we send a fixed estimate for the first milestone.
Monitoring dashboard
- Timeline
- 8–12 weeks
- Budget
- from 35k USD
Real-time dashboard over your existing strategies or venue data: positions, P&L, alerts, operator controls.
Trading platform
- Timeline
- 4–6 months
- Budget
- 80–160k USD
Multi-venue data pipeline, order management, charting, risk controls, user management and reporting.
Team extension
- Timeline
- ongoing
- Budget
- monthly
Front-end or data engineers embedded in your trading technology team.
Frequently asked questions.
01Which markets and venues can you connect to?
Crypto exchanges via REST and WebSocket APIs, and traditional brokers and data vendors via their APIs or FIX. Each venue gets an adapter that maps into one internal model, so adding a venue later does not touch the UI.
02Do you write trading strategies?
We build the infrastructure around strategies: data, execution, monitoring and controls. Strategy logic stays with your team; we integrate with it through clear interfaces.
03How do you handle latency and reliability?
Reconnect with backoff and snapshot re-sync, sequence-number gap detection, server-side rate limiting and client-side batching of updates. For most dashboards, perceived latency is dominated by rendering, which is why we invest in selective rendering.
04Can you build mobile versions?
Yes. The data layer is shared; we deliver responsive web first and add native or cross-platform mobile clients when the product needs them.
Blog.
Planning something like this?
Tell us what you want to launch and when. An engineer will reply within 24 hours with questions, a draft scope and a realistic estimate.